
 +1 844-445-5767
 +971 56-848-5757
 +91 921-208-0630
For Business & Service Inquiries
Sales Team
Project quotes, partnerships, implementation
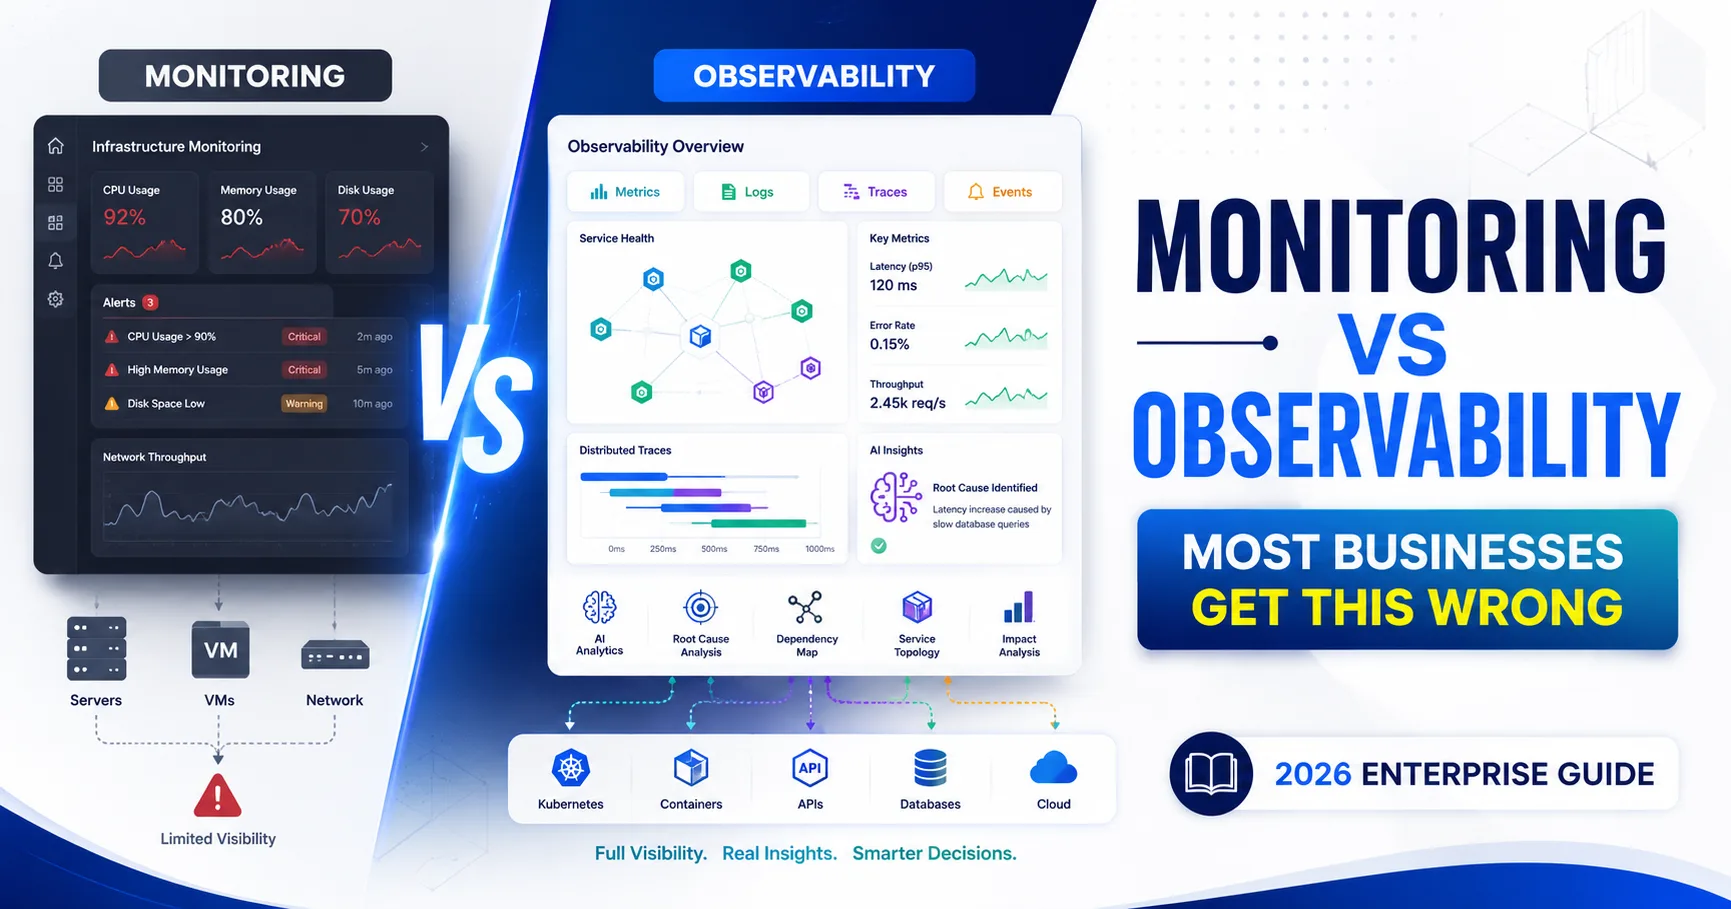
TL;DR: Monitoring tracks predefined metrics and alerts teams when thresholds are breached. Observability goes further—it uses metrics, logs, traces, and events to explain why a failure occurred. Modern enterprises running distributed, cloud-native, or hybrid infrastructures need both to maintain reliability, accelerate incident response, and reduce operational costs.
Every operations team has been there. An alert fires at 2 a.m. The dashboard shows a spike. But the spike—where did it originate? Was it the payment microservice, the Kubernetes node it runs on, the upstream API it depends on, or the cloud network path between regions? Monitoring told you something was wrong. It could not tell you why.
That gap—between knowing that a problem exists and understanding why it exists—defines the fundamental difference between monitoring and observability. And as enterprise infrastructure has grown more distributed, that gap has widened considerably.
Microservices architectures, containerized workloads, Kubernetes orchestration, hybrid cloud deployments, and multi-region API meshes have collectively made systems harder to reason about. A single user-facing transaction may now traverse dozens of services across multiple cloud providers before completing. Traditional monitoring tools were not built for this level of complexity. They were designed for servers in a rack, not ephemeral pods in a cluster.
This is not an argument against monitoring—it remains essential. But the question of observability vs monitoring is no longer academic. It is a strategic infrastructure decision that directly affects uptime, developer velocity, customer experience, and incident resolution time. This guide breaks down both disciplines in depth: what they are, where they differ, when each applies, and how leading organizations are using them together to build resilient, self-healing systems at scale.
Monitoring is the practice of collecting, tracking, and alerting on predefined metrics to assess the health and performance of IT systems. It answers one primary question: Is the system behaving as expected?
When a metric—CPU utilization, memory usage, error rate, response latency—crosses a defined threshold, monitoring tools trigger an alert. Teams then investigate and respond. Monitoring is fundamentally reactive: it detects deviations from known baselines and notifies the right people.
Monitoring spans several disciplines across the infrastructure stack:
Monitoring is effective when failures follow known patterns. Its limitations emerge in dynamic, distributed environments:
Observability is the ability to infer the internal state of a system from its external outputs. It goes beyond tracking predefined metrics—it captures rich telemetry data that allows engineers to ask arbitrary questions about system behavior, even for failure modes that were never anticipated.
The term originates from control theory: a system is observable if its internal states can be determined from its outputs. Applied to software and infrastructure, observability means that teams can reason about what is happening inside complex, distributed systems by analyzing the data those systems emit—without requiring a pre-existing alert rule or dashboard for every possible failure scenario.
Observability is proactive and exploratory. It enables teams to investigate unknown unknowns—the failure modes no one predicted and no one built an alert for.
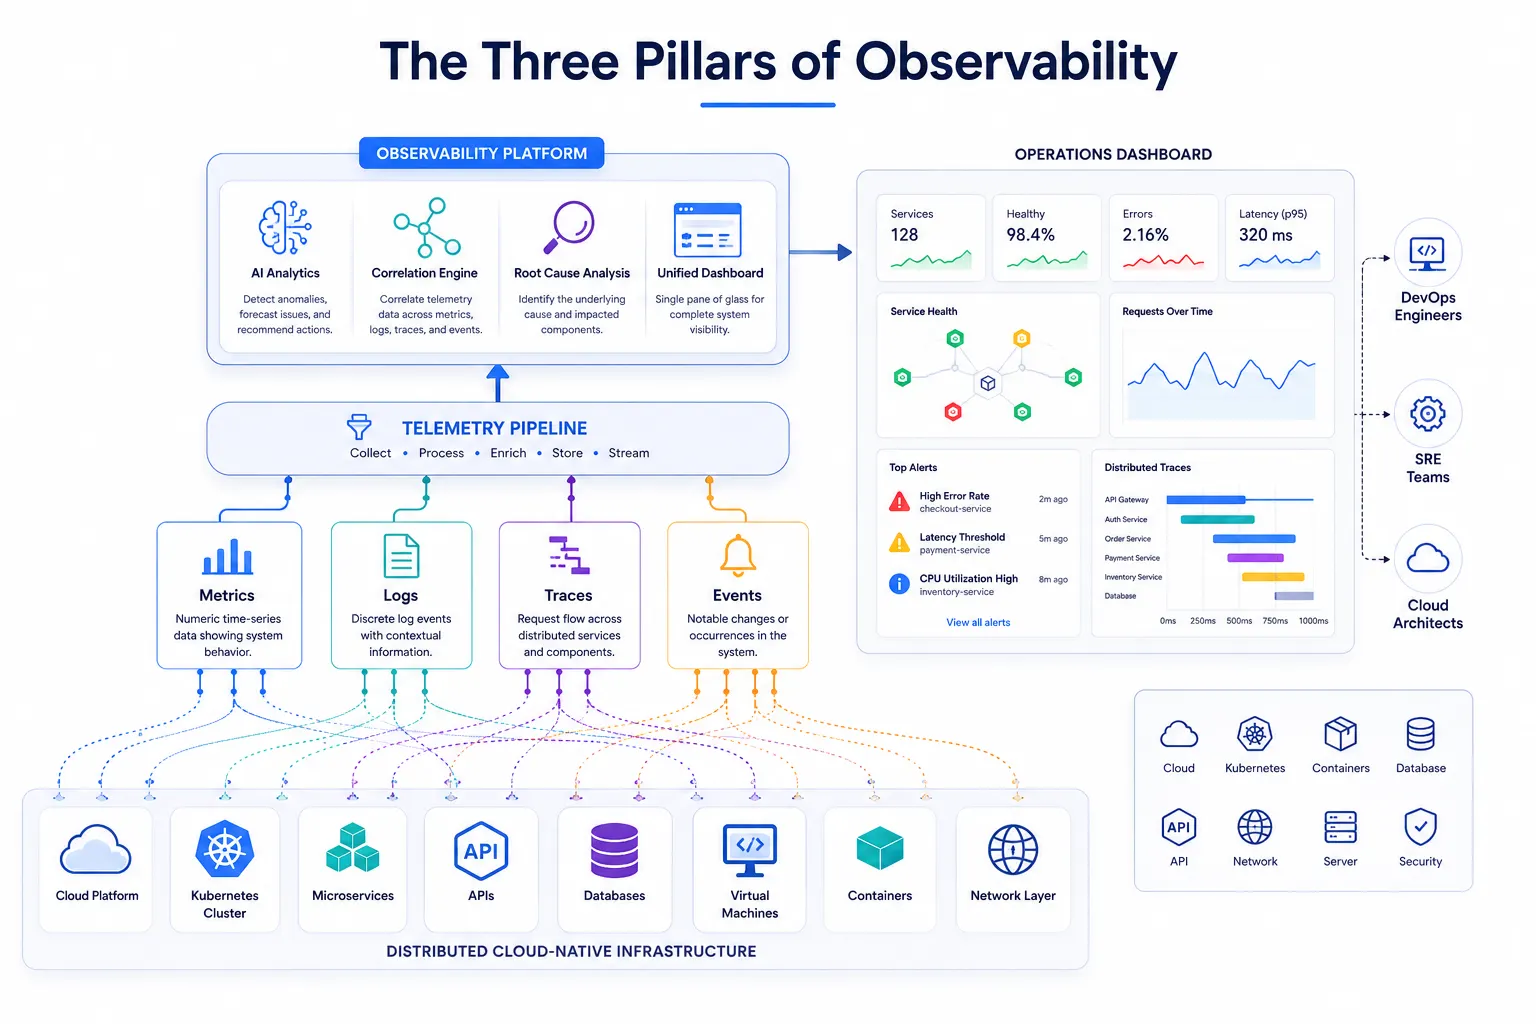
Observability platforms collect and correlate three primary telemetry types, commonly referred to as the "three pillars":
1. Metrics
Quantitative measurements sampled over time: request rate, error rate, latency percentiles (p50, p95, p99), CPU utilization, and memory consumption. Metrics are efficient to store and query, making them ideal for dashboards and trend analysis. The Prometheus/Grafana stack is the dominant open-source choice for metrics collection and visualization.
2. Logs
Detailed, timestamped records of discrete events emitted by applications and infrastructure components. Logs provide granular context—what happened, when it happened, on which service, and under what conditions. Structured logging (JSON-formatted logs with consistent fields) significantly improves searchability and correlation.
3. Traces
Distributed traces capture the end-to-end journey of a single request as it flows through multiple services, databases, and external APIs. Each trace is composed of spans—individual units of work with timing, metadata, and relationship context. Tracing is the only mechanism that reveals latency contributions and failure points across service boundaries in a microservices architecture. Tools include Jaeger, Zipkin, and OpenTelemetry-compatible collectors.
Beyond the three pillars, mature observability platforms also incorporate:
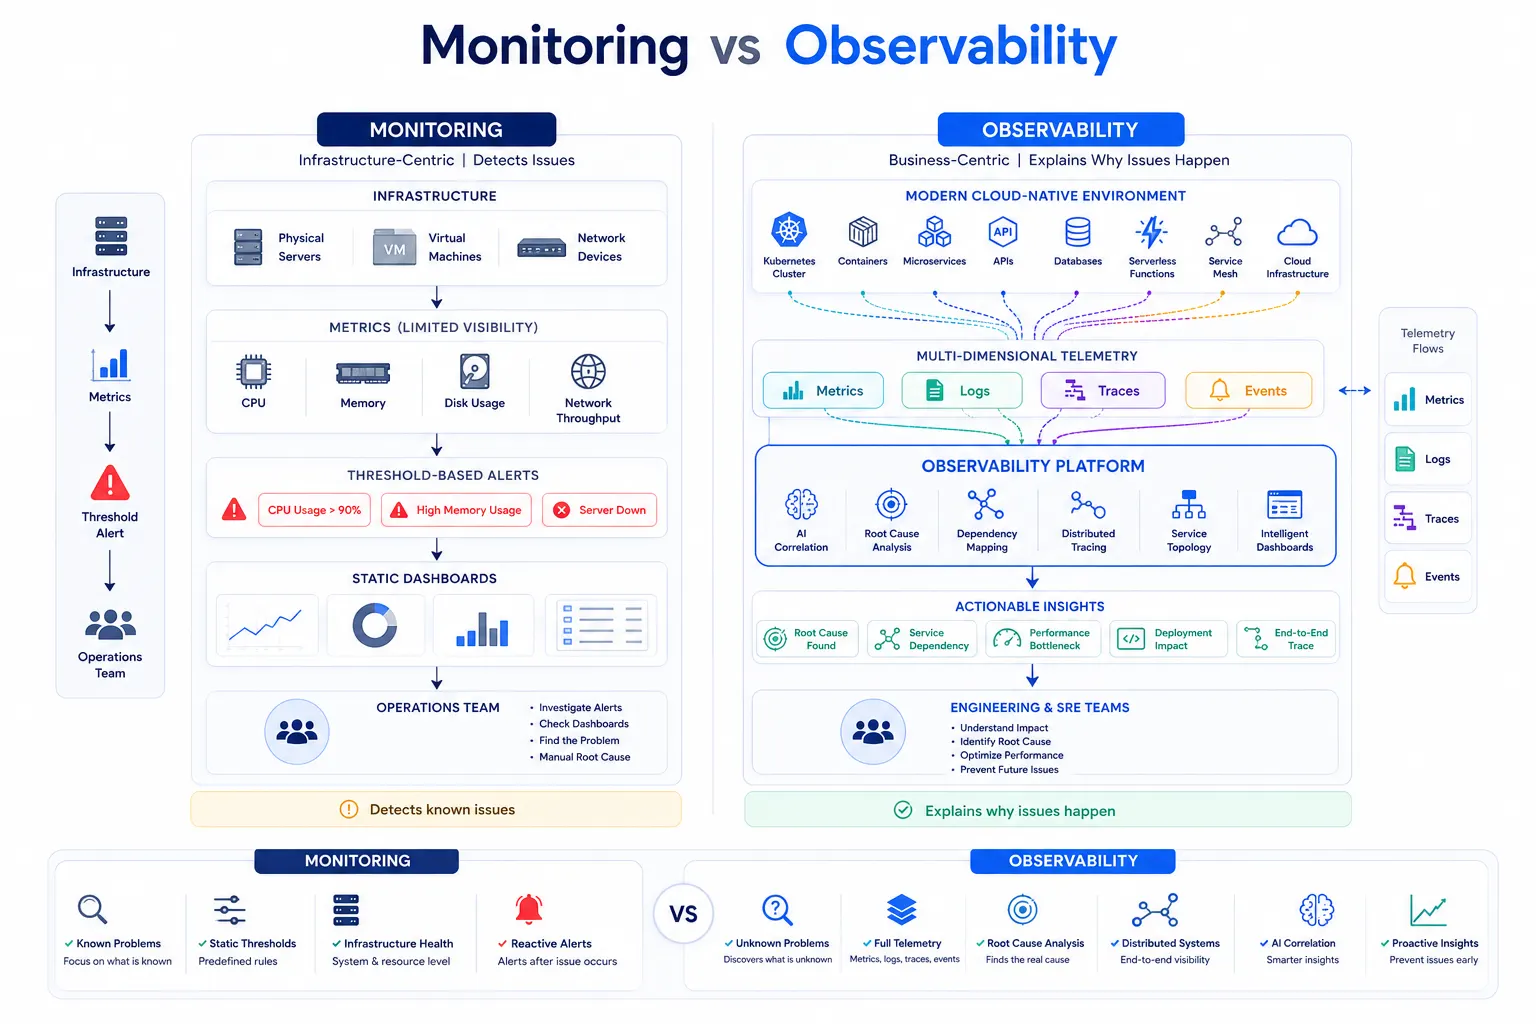
The difference between monitoring and observability comes down to scope and intent. Monitoring answers questions you already know to ask—did CPU exceed 90%? Did error rate spike? Observability answers questions you didn't anticipate—why did latency increase for a subset of users in one region during a specific deployment window? Monitoring is reactive; observability is investigative and proactive.
The table below provides a structured comparison across the dimensions that matter most to enterprise architecture teams.
|
Dimension |
Monitoring |
Observability |
|---|---|---|
|
Primary Goal |
Detect known failure conditions |
Understand system behavior, including unknown failures |
|
Approach |
Reactive — alerts when thresholds are breached |
Proactive — enables arbitrary investigation of system state |
|
Core Data Sources |
Metrics, logs |
Metrics, logs, traces, events, profiling, RUM |
|
Alert Model |
Predefined static thresholds |
Dynamic anomaly detection, AI-driven correlation |
|
Root Cause Analysis |
Limited — identifies what failed |
Comprehensive — explains why and how failures occurred |
|
Unknown Problems |
Cannot detect what was not anticipated |
Designed to surface unknown unknowns |
|
Cloud-Native Readiness |
Limited in dynamic, ephemeral environments |
Built for containers, Kubernetes, microservices, and serverless |
|
Kubernetes Support |
Partial — struggles with pod-level ephemeral context |
Full — traces span pod lifecycles across namespaces |
|
AI Readiness |
Low — rule-based alerting |
High — ML-driven anomaly detection and predictive analytics |
|
Automation Support |
Alert-triggered remediation |
Autonomous self-healing workflows via AIOps integration |
|
Scalability |
Degrades as system complexity grows |
Scales with distributed architectures |
|
Cost |
Lower initial investment |
Higher instrumentation investment; lower incident costs |
|
Best Use Cases |
Stable, well-understood systems; SLA reporting; compliance |
Microservices, hybrid cloud, distributed systems, DevOps pipelines |
|
Visibility Scope |
Per-component |
End-to-end, cross-service, full-stack |
|
Tooling Examples |
Nagios, Zabbix, Prometheus, CloudWatch |
Datadog, Dynatrace, New Relic, Honeycomb, Grafana + Tempo |
The framing of observability vs monitoring as an either/or choice misrepresents how mature operations teams actually work. The two disciplines are complementary, not competitive—particularly for organizations building resilient cloud architecture across hybrid and multi-cloud environments. Monitoring provides the fast-signal layer—immediate alerting on known conditions. Observability provides the depth needed to understand, diagnose, and permanently resolve the issues those alerts surface.
Consider a concrete scenario: a monitoring alert fires indicating that API response times have degraded beyond the SLA threshold. That alert is valuable—it triggers incident response immediately. But resolving the incident requires observability. Distributed traces reveal that a downstream database query is consuming 4 seconds of latency for requests routed through a specific availability zone. Logs from that zone show a configuration drift introduced by a recent infrastructure-as-code deployment. Without trace context and correlated log data, the team would be guessing.
The operational environments that benefit most from combining both capabilities include:
According to Gartner, by 2026, over 60% of large enterprises will have moved toward self-healing systems powered by AIOps—systems that combine monitoring signals with observability data to autonomously detect, diagnose, and remediate incidents without human intervention.
Distributed traces pinpoint the exact service, method, and line of code contributing to a failure. What previously required hours of log searching now takes minutes. Engineering teams spend less time in war rooms and more time shipping improvements.
William Hill, a global sports betting platform processing 5.2 million transactions daily, implemented observability tools and achieved an 80% improvement in mean time to resolution (MTTR), resolving their most critical P1 incidents in under 60 minutes. Reduced MTTR directly translates to reduced revenue impact and reputational risk.
Observability correlates technical telemetry with user-facing outcomes. Teams can see not just that latency increased, but that it increased specifically for mobile users in a particular region completing checkout transactions—enabling targeted, high-priority remediation.
Machine learning models trained on historical telemetry identify deviations from normal behavior before they breach alert thresholds. This shifts the operational posture from reactive firefighting to proactive prevention.
Observability platforms continuously profile traffic patterns and system behavior. Anomalous network flows, unexpected authentication failures, or unusual API access patterns trigger alerts before they escalate into breaches. This capability integrates directly with IT infrastructure security best practices to create a defense-in-depth posture.
Developers, SREs, and platform engineers work from a shared telemetry plane. Deployment events are correlated with performance changes, making it straightforward to identify whether a new code release introduced a regression—without finger-pointing between teams.
Historical observability data supports accurate demand forecasting. Rather than overprovisioning to absorb uncertainty, infrastructure teams can right-size resources based on real traffic patterns. IBM's research indicates that IBM Instana Observability delivers a 219% ROI and reduces developer troubleshooting time by 90%.
Observability addresses complexity; monitoring addresses immediacy. The benefits of a well-configured monitoring stack remain significant:
Effective infrastructure management services rely on monitoring as the operational baseline—the always-on layer that ensures nothing falls through the cracks before observability tools can provide deeper context.
Network observability is the practice of gaining comprehensive, real-time visibility into the performance, behavior, and health of a computing network by collecting and correlating telemetry from every layer of the network stack—routers, switches, load balancers, API gateways, cloud networking fabrics, and SD-WAN overlays. It answers not just whether the network is reachable, but why specific paths degrade, how traffic flows across hybrid environments, and what changes caused a performance shift.
Traditional network performance monitoring (NPM) tools use SNMP polling and predefined thresholds to track latency, packet loss, bandwidth utilization, and device health on a per-device basis. This model works adequately for static, on-premises networks but fails in several important ways in modern environments:
Network observability addresses each of these limitations by collecting richer telemetry—flow records, packet captures, BGP routing updates, DNS query logs, and Kubernetes network metrics—and correlating them across the full path from client to service.
Network observability, as defined by IBM, is built on five pillars that work in combination:
Modern enterprise networks span on-premises data centers, multiple cloud providers, SD-WAN overlays, and Kubernetes networking (CNI plugins, service meshes like Istio). Network observability provides:
In financial services, where high-frequency trading environments cannot tolerate millisecond-level latency variations, network observability tools detect and resolve path-level degradation before it affects transaction outcomes. In telecommunications, network observability is foundational to managing 5G network slices and ensuring ultra-reliable, low-latency performance for critical use cases such as autonomous vehicle connectivity.
Banks and trading platforms use observability to correlate application performance with network telemetry in real time. Payment processing pipelines span multiple microservices across hybrid cloud environments—observability ensures that any degradation in the transaction path is detected, diagnosed, and resolved before it affects customer-facing outcomes or regulatory reporting.
Hospital systems and health technology platforms operate under strict uptime and compliance requirements. Observability provides end-to-end visibility into EHR systems, telehealth platforms, and medical device integrations—enabling teams to identify data pipeline bottlenecks, API failures, and security anomalies without disrupting clinical workflows.
During peak traffic events (Black Friday, product launches), distributed tracing reveals exactly where checkout latency originates—whether in the payment gateway, inventory service, or CDN layer. Proactive anomaly detection prevents cart abandonment caused by performance degradation that monitoring thresholds alone would miss.
Industrial IoT environments generate telemetry from thousands of connected devices across factory floors and supply chains. Observability platforms correlate sensor data, network metrics, and application logs to identify production anomalies, equipment failures, and supply chain disruptions before they halt operations. This aligns directly with infrastructure automation tools that underpin modern industrial operations.
Government agencies running citizen-facing digital services rely on observability to meet availability SLAs while maintaining security and compliance posture. Full-stack visibility ensures that performance issues and security events are surfaced and addressed without manual log-sifting across siloed systems.
Multi-tenant SaaS providers use observability to isolate whether a performance issue affects a single tenant or the entire platform—a distinction that monitoring alone cannot make. Trace data tied to tenant identifiers enables engineering teams to diagnose tenant-specific configuration issues, noisy-neighbor effects, or resource contention without exposing cross-tenant data.
Observability tooling spans several categories. The right stack depends on infrastructure type, team maturity, and budget:
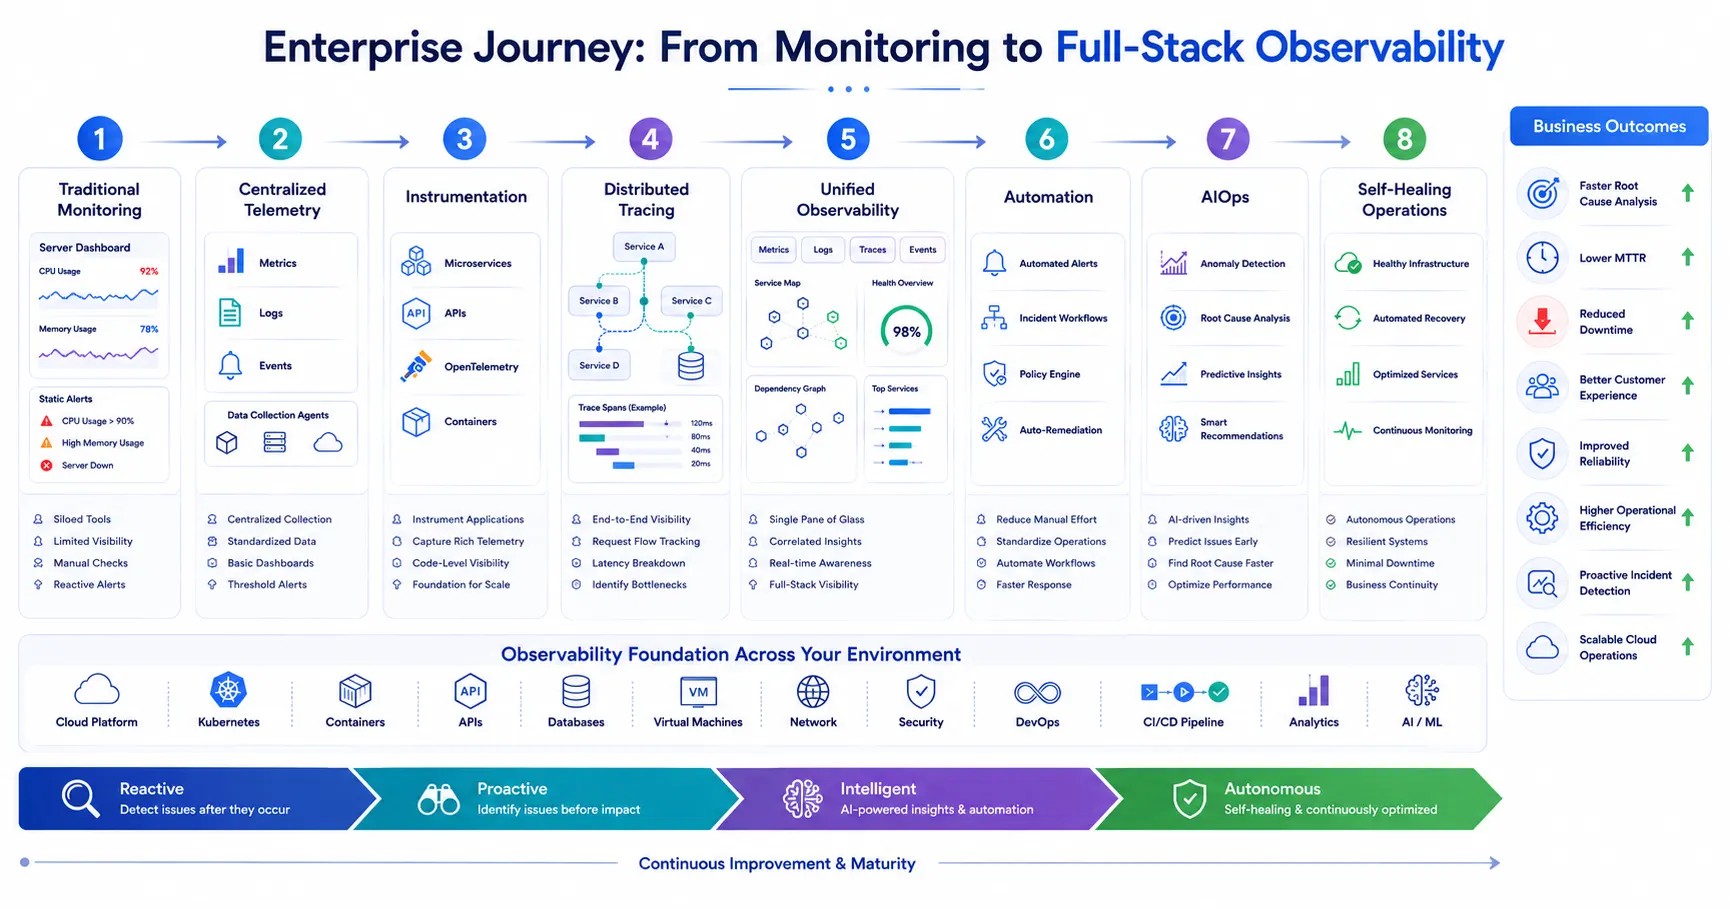
Moving from a purely monitoring-based approach to a full observability practice is a phased journey, not an overnight migration. The roadmap below reflects what enterprise infrastructure and DevOps teams typically follow:
|
Phase |
Action |
Key Deliverable |
|---|---|---|
|
1. Assessment |
Audit current monitoring coverage; identify blind spots in distributed systems |
Gap analysis report: what is monitored vs. what is unobservable |
|
2. Telemetry Strategy |
Define which services require metrics, logs, traces, and events; establish data retention policies |
Telemetry coverage matrix by service and environment |
|
3. Instrumentation |
Instrument applications using OpenTelemetry SDKs; standardize log formats to structured JSON |
Consistent, vendor-neutral telemetry emitted from all services |
|
4. Distributed Tracing |
Deploy a tracing backend (Jaeger, Grafana Tempo); enable trace context propagation across service boundaries |
End-to-end trace visibility for all critical transaction paths |
|
5. Unified Dashboards |
Build service-level objective (SLO) dashboards correlating metrics, logs, and traces in a single pane |
Operational dashboards aligned to business outcomes |
|
6. Alert Refinement |
Replace static thresholds with SLO-based alerting; implement anomaly detection |
Reduced alert noise; higher signal-to-noise ratio |
|
7. AIOps Integration |
Connect telemetry pipelines to AIOps platforms for automated correlation and root cause analysis |
Autonomous incident detection with actionable root cause context |
|
8. Continuous Improvement |
Establish blameless postmortem processes; use observability data to improve instrumentation quality over time |
Continuously improving observability maturity and system reliability |
Effective cloud infrastructure management is a prerequisite for a successful observability implementation. Teams that lack foundational cloud governance—consistent tagging, automated provisioning, and defined network topology—will find that observability data is too fragmented to be actionable.
Standardize on OpenTelemetry from the start. Vendor lock-in is one of the most expensive mistakes in observability. Instrumenting with OpenTelemetry ensures portability across backends and future-proofs your telemetry investment.
Define Service Level Objectives (SLOs) before building dashboards. Dashboards built without SLOs visualize data without purpose. Start with business-aligned SLOs—availability, latency, and error rate targets—then build observability around proving or disproving those targets.
Use structured, contextual logging. Unstructured logs are searchable but not queryable. JSON-formatted logs with consistent fields (service name, trace ID, request ID, environment) enable correlation across the telemetry stack and dramatically accelerate root cause analysis.
Instrument at the service boundary, not just the infrastructure layer. Infrastructure monitoring tells you whether the host is healthy. Service-level instrumentation tells you whether the service is serving customers correctly. Both are necessary; neither alone is sufficient.
Correlate observability data with deployment events. Configuration changes and code deployments are among the most common causes of production incidents. Tagging telemetry with deployment metadata enables engineers to immediately determine whether a change introduced a regression.
Implement disaster recovery and business continuity planning in parallel. Observability accelerates incident detection; disaster recovery plans determine what happens after detection. Organizations that invest in observability without corresponding recovery playbooks still suffer extended outages when incidents occur.
Treating observability as a tool purchase, not a practice. Installing Datadog or Dynatrace does not make a system observable. Observability requires disciplined instrumentation, defined SLOs, and a culture of using telemetry data to drive decisions.
Over-alerting on monitoring thresholds. Alert fatigue is one of the most damaging operational dysfunctions. Teams that configure hundreds of static threshold alerts without SLO alignment quickly learn to ignore notifications—including critical ones.
Neglecting east-west traffic. Most monitoring tools focus on north-south traffic (external requests in). Microservices architectures generate enormous east-west traffic (service-to-service). Without tracing this traffic, root cause analysis in distributed systems is guesswork.
Skipping cardinality planning for metrics. High-cardinality metrics (labeled with user IDs, tenant IDs, or request paths) can cause storage and query performance issues in time-series databases. Plan cardinality limits before instrumenting at scale.
Ignoring Fortune 500-grade multi-cloud IaC practices when deploying observability tooling across cloud environments. Observability infrastructure itself must be managed as code, version-controlled, and reproducible—not configured manually and inconsistently across regions.
AI-Driven Observability (AIOps)
AIOps platforms are moving beyond correlation into autonomous remediation. By 2026, according to Gartner, over 60% of large enterprises will have implemented self-healing systems that detect, diagnose, and resolve incidents without human intervention. This shifts the SRE role from incident response to reliability engineering.
OpenTelemetry as the Universal Standard
OpenTelemetry adoption continues to accelerate across every major cloud provider, APM vendor, and infrastructure platform. Organizations that standardize on OpenTelemetry today gain flexibility to switch backends without re-instrumenting—a significant long-term cost advantage.
Predictive Analytics and Capacity Planning
Machine learning models trained on historical telemetry data are enabling accurate capacity forecasting. Instead of overprovisioning to absorb demand uncertainty, infrastructure teams will right-size resources in real time based on predicted load curves.
Edge and IoT Observability
As compute moves to the edge—5G base stations, retail point-of-sale systems, factory floors—observability tooling must follow. Lightweight, bandwidth-efficient telemetry collection agents designed for constrained edge environments are an active development area across all major platforms.
Full-Stack Observability
The convergence of network observability, infrastructure observability, application observability, and security observability into unified platforms eliminates the siloed tooling that forces engineers to context-switch between systems during an incident. Full-stack observability is becoming the expected baseline for enterprise operations teams.
Security Observability
Traditional SIEM tools and observability platforms are converging. Security teams increasingly require the same telemetry that SRE teams use—distributed traces, network flow data, and behavioral baselines—to detect sophisticated threats that evade signature-based detection.
Agentic AI in Operations
Large language model-powered agents are beginning to appear in observability platforms, capable of querying telemetry data in natural language, generating postmortem reports automatically, and proposing remediation steps based on similar past incidents. This capability will fundamentally change how operations teams interact with observability data.
The observability vs monitoring debate resolves to a simple conclusion for teams relying on enterprise infrastructure management: you need both, and you need them integrated. Monitoring provides the fast-signal layer that triggers immediate response. Observability provides the depth that enables permanent resolution. Neither discipline alone is sufficient for the complexity of modern distributed systems.
The organizations that will maintain competitive advantage through 2026 and beyond are those building toward full-stack observability—unified telemetry across applications, infrastructure, networks, and security, correlated by AI, and acted on by autonomous remediation workflows. That capability does not emerge from a single tool purchase. It emerges from disciplined instrumentation, standardized telemetry, clear SLOs, and a culture that treats system transparency as a first-class engineering concern.
For infrastructure and DevOps teams beginning this journey, the first step is understanding where your current monitoring coverage ends and where your observability blind spots begin. SISGAIN's engineering teams work with organizations across industries to assess monitoring maturity, design observability architectures, and implement the telemetry pipelines and AIOps integrations needed to operate reliably at scale.
Start Build Your
Next Digital Solution?
Let’s build scalable, future-ready digital solutions tailored to your business goals. Connect with our experienced technology consultants to discuss your vision, strategy, and growth opportunities — with zero obligation and complete transparency.
Get a free consultation and cost estimate for your digital solution
Our expert will contact you within 24 hours. Check your email for confirmation.
Partner with SISGAIN experts to build secure, scalable AI-powered IT Solutions that transform your business operations.









DUQE FREEZONE Quarter Deck, Queen Elizabeth 2, Mina Rashid, Dubai, UAE

100 Consilium Pl Suite 200, Scarborough, ON M1H 3E3, Canada

C-109, Sector 2, Noida, Uttar Pradesh 201301 India
Project quotes, partnerships, implementation
Open roles, referrals, campus hiring