
For Business & Service Inquiries
Sales Team
Project quotes, partnerships, implementation
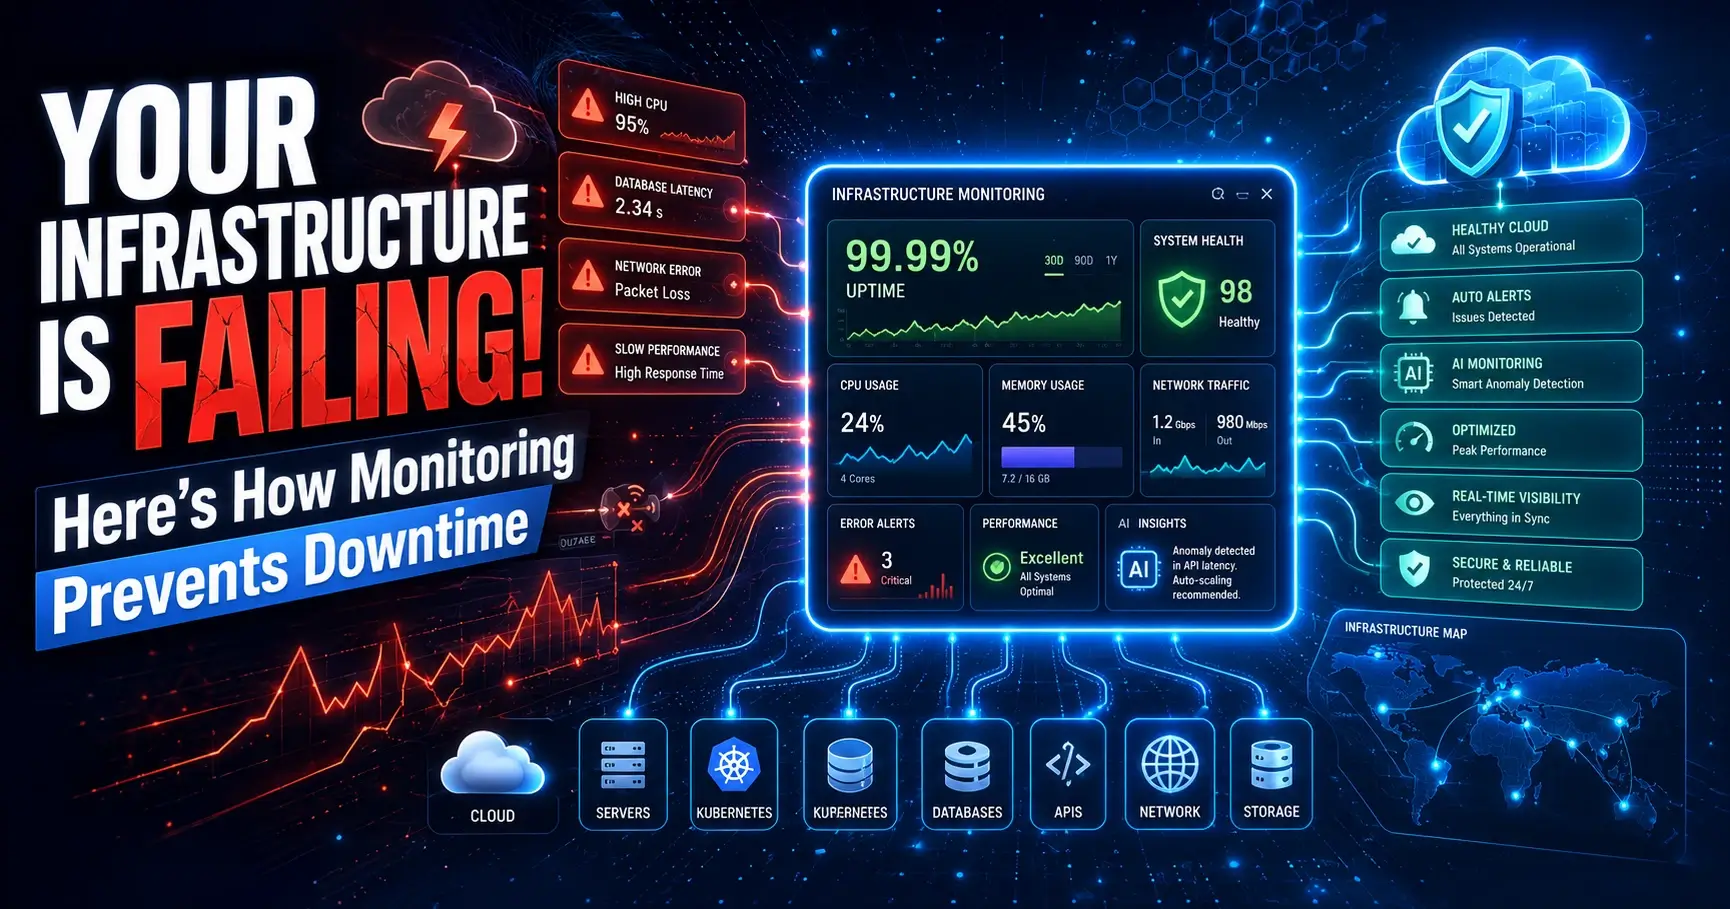
Every minute an application is slow or unreachable, someone downstream feels it — a customer abandons a cart, a clinician can't pull up a patient record, a trader misses a window. Infrastructure monitoring exists to make sure that minute never happens unnoticed, and ideally, never happens at all.
Modern IT environments have outgrown the simple "ping a server and wait" model. A single enterprise application today might touch a Kubernetes cluster, three cloud regions, a managed database, a CDN, and a handful of third-party APIs — any one of which can quietly degrade and take the rest down with it. The cost of downtime has climbed in lockstep with this complexity: large enterprises now routinely measure outage costs in the tens of thousands of dollars per minute once you account for lost revenue, SLA penalties, support overhead, and reputational damage.
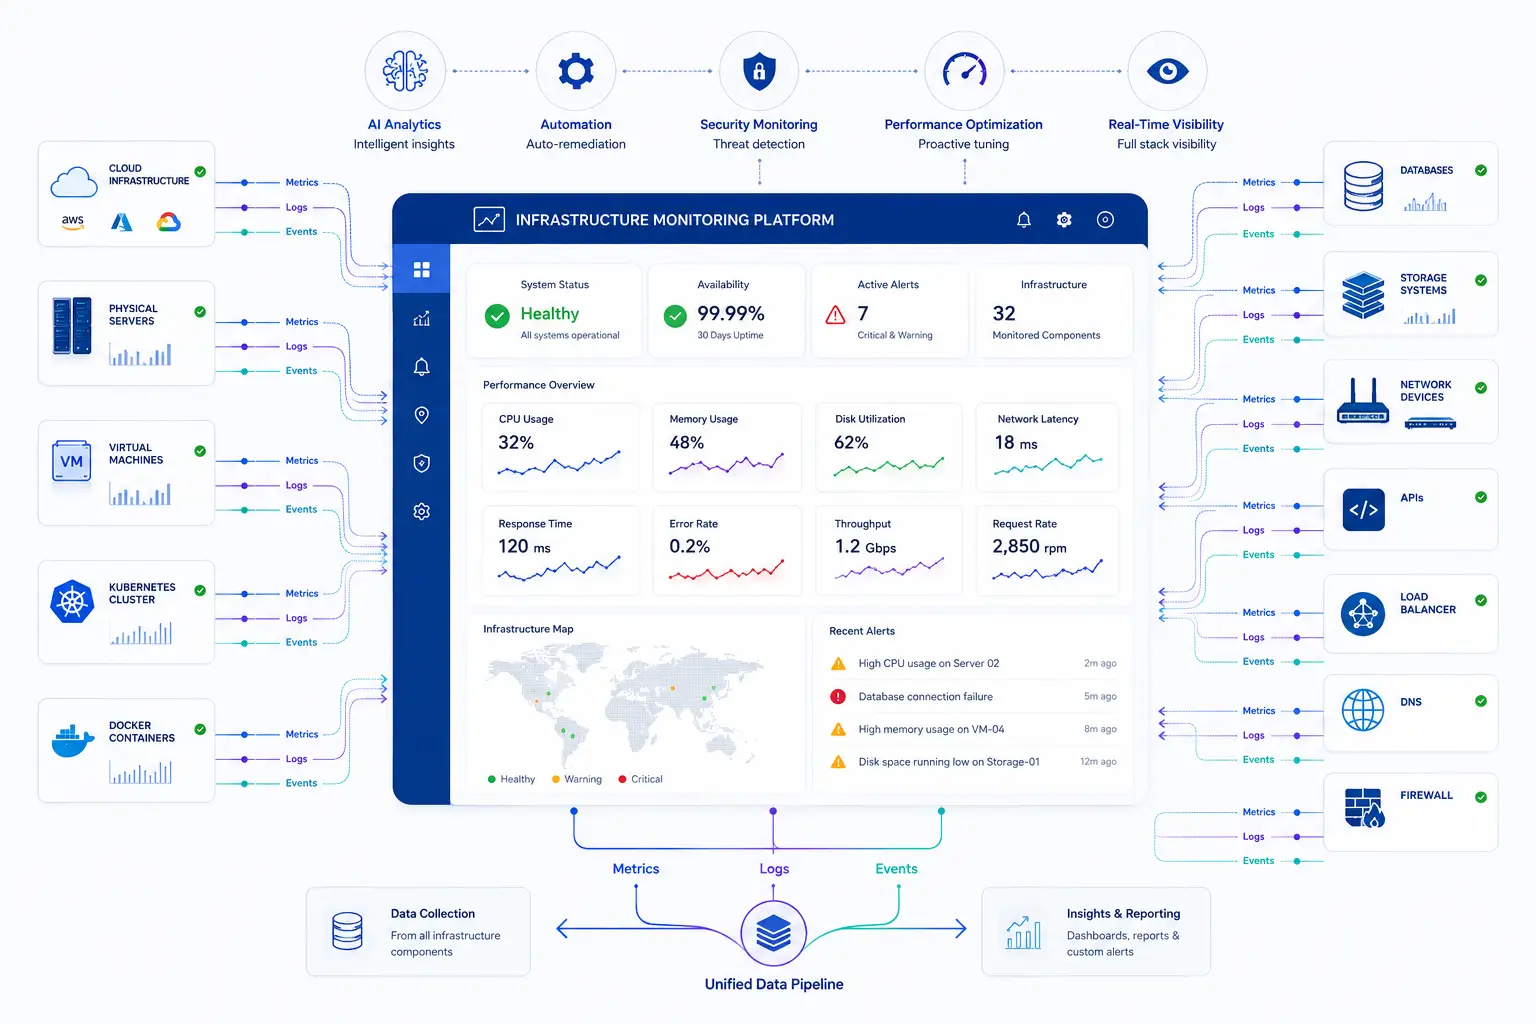
That's the core problem infrastructure monitoring solves. It gives IT teams continuous, real-time visibility into the health, performance, and availability of every layer of the technology stack — servers, networks, storage, databases, virtual machines, containers, and cloud resources — so problems are caught and fixed before customers notice them.
This guide is written for the people who own that responsibility: DevOps engineers building monitoring pipelines, CTOs evaluating tooling budgets, system administrators on call at 2 a.m., and cloud architects designing for scale. We'll cover what infrastructure monitoring actually is, how it works under the hood, the metrics that matter, the tools and categories worth evaluating, and the practices that separate teams who catch issues in seconds from teams who find out from an angry customer.
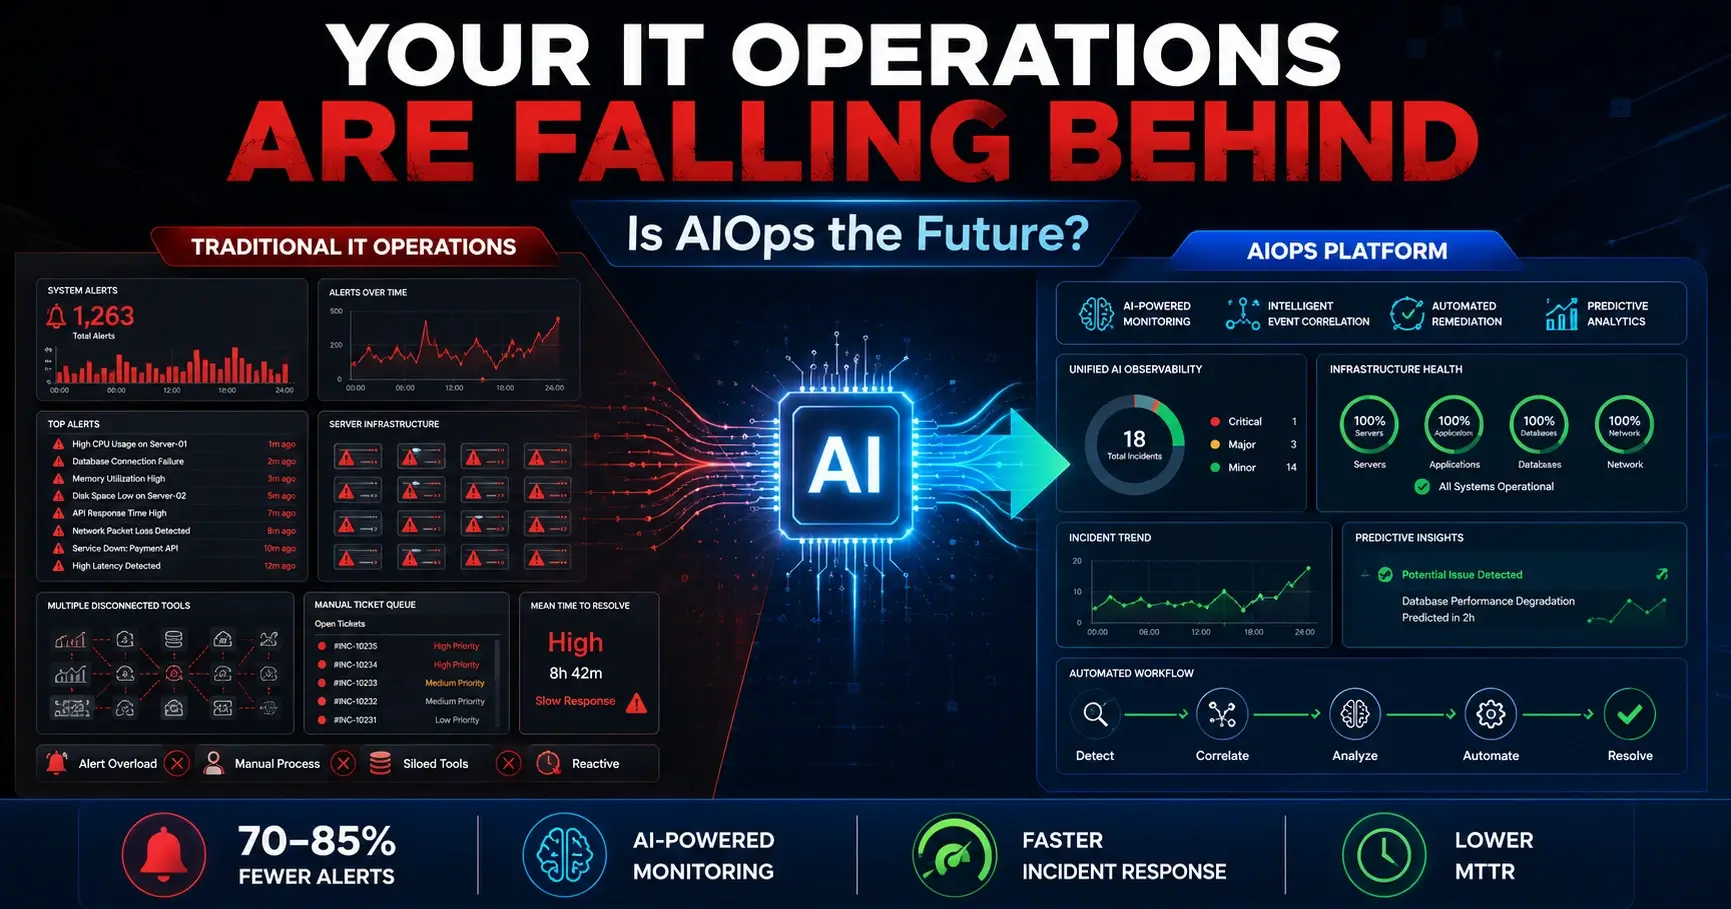
Reactive monitoring — waiting for something to break, then scrambling — was tolerable when infrastructure was simple and predictable. It isn't anymore. Distributed systems fail in distributed ways, and the only sustainable answer is proactive, automated, real-time visibility across the entire environment.
Infrastructure monitoring is the continuous process of collecting, analyzing, and acting on data about the health and performance of an organization's IT infrastructure — physical servers, virtual machines, networks, storage systems, databases, containers, and cloud resources.
At its core, the purpose is simple: know what's happening across your environment at all times, and know it before your customers do. In practice, that means tracking availability (is it up?), performance (is it fast enough?), and capacity (is it about to run out of room?) across every component that supports a business application.
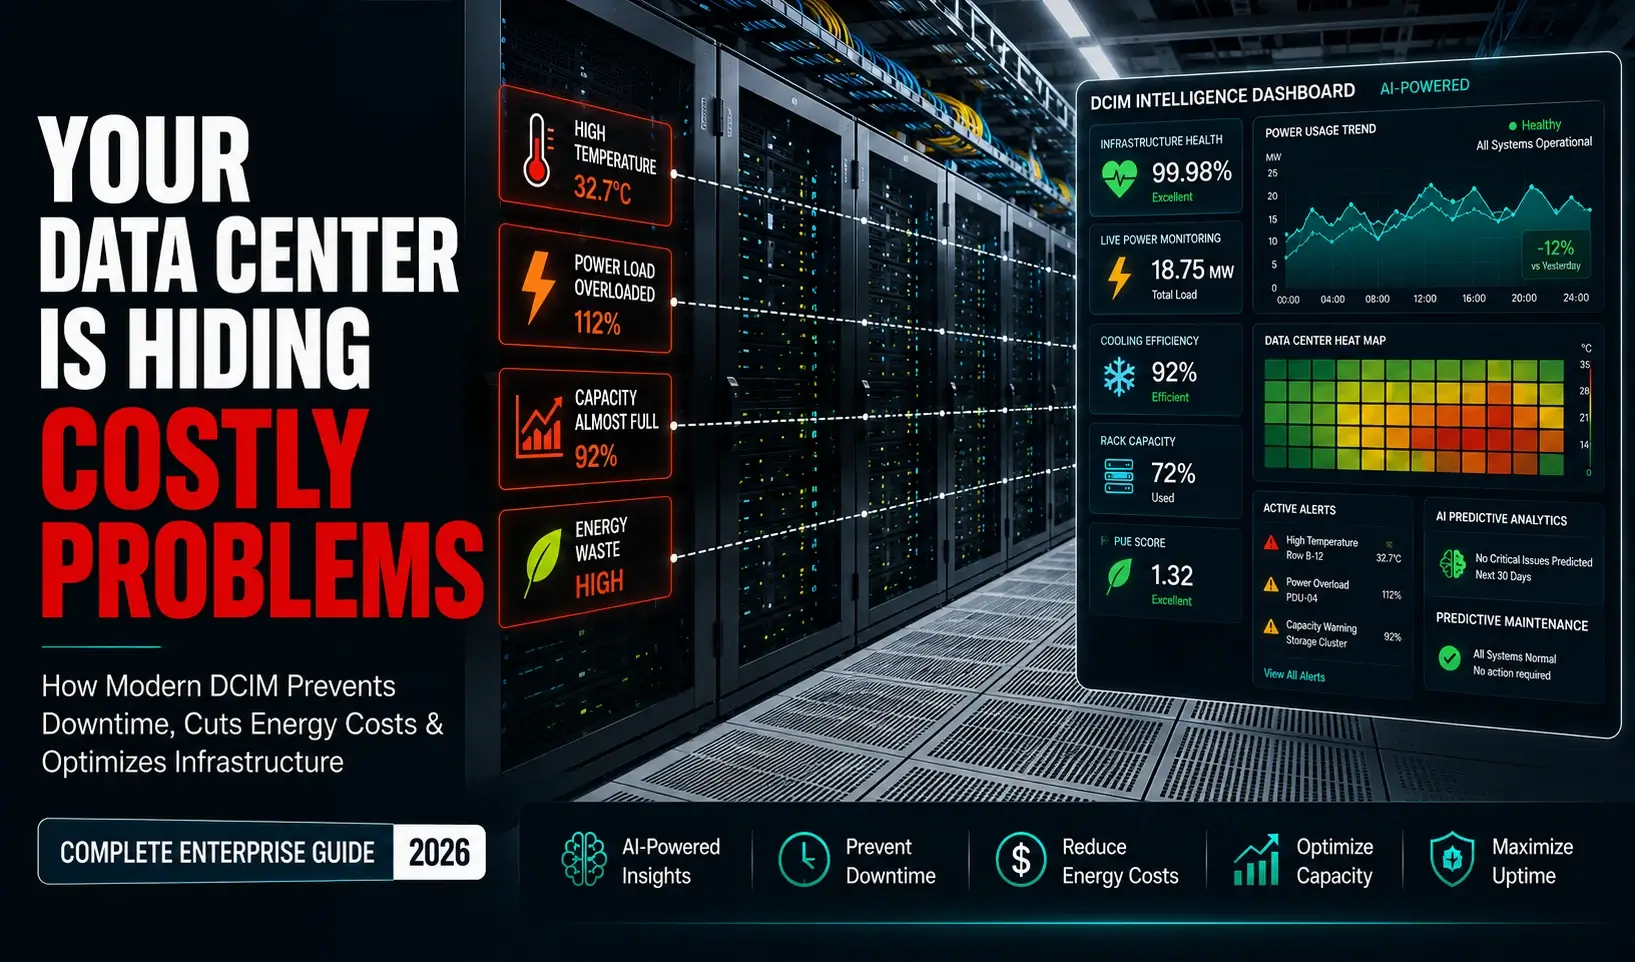
How it works, in plain terms: lightweight agents or API integrations sit on or near each resource, collecting metrics, logs, and events at regular intervals. That data flows into a central platform that stores it, visualizes it on dashboards, compares it against thresholds, and fires an alert the moment something looks wrong — a CPU pegged at 95%, a disk filling up, a network link dropping packets, a database connection pool exhausting.
Business value: infrastructure monitoring converts uncertainty into evidence. Instead of guessing why an application feels slow, an SRE can look at a dashboard and see, within seconds, that a specific database node is running hot. Instead of discovering a storage volume is full after an application crashes, capacity alerts give the team days of advance warning.
Real-world example: a retail company running a multi-region e-commerce platform sets monitoring thresholds on checkout-service latency and database connection counts. During a flash sale, traffic triples. Monitoring detects rising latency and connection saturation in real time, triggers an autoscaling policy, and pages the on-call engineer — all before a single customer experiences a failed checkout. That's the difference proactive infrastructure monitoring makes in practice.
Infrastructure monitoring isn't a "nice to have" dashboard exercise — it directly protects revenue, trust, and compliance posture. Here's why it matters at the leadership level, not just the engineering level.
Uptime and reliability. Every additional nine of availability (99.9% vs 99.99%) represents hours of difference in annual downtime. Monitoring is the mechanism that makes those targets achievable, because you can't improve what you can't see.
Performance. Uptime alone isn't enough — a "technically available" application that takes eight seconds to load is still failing the user. Monitoring tracks response time, throughput, and resource utilization so performance degradation is caught before it becomes an outage.
Security visibility. Unusual spikes in network traffic, unexpected processes consuming CPU, or unauthorized access attempts often show up first as infrastructure anomalies. Monitoring is frequently the earliest signal in an incident response timeline.
User experience. Page load times, API latency, and transaction completion rates all trace back to infrastructure health. Monitoring connects backend performance to the experience customers actually feel.
Compliance. Regulated industries — healthcare, banking, government — must demonstrate system availability, data integrity, and audit trails. Monitoring data is often the evidence auditors ask for directly.
Capacity planning. Trend data from monitoring tells you when you'll outgrow current infrastructure, months before it becomes urgent, turning capacity decisions into planned investments rather than emergency purchases.
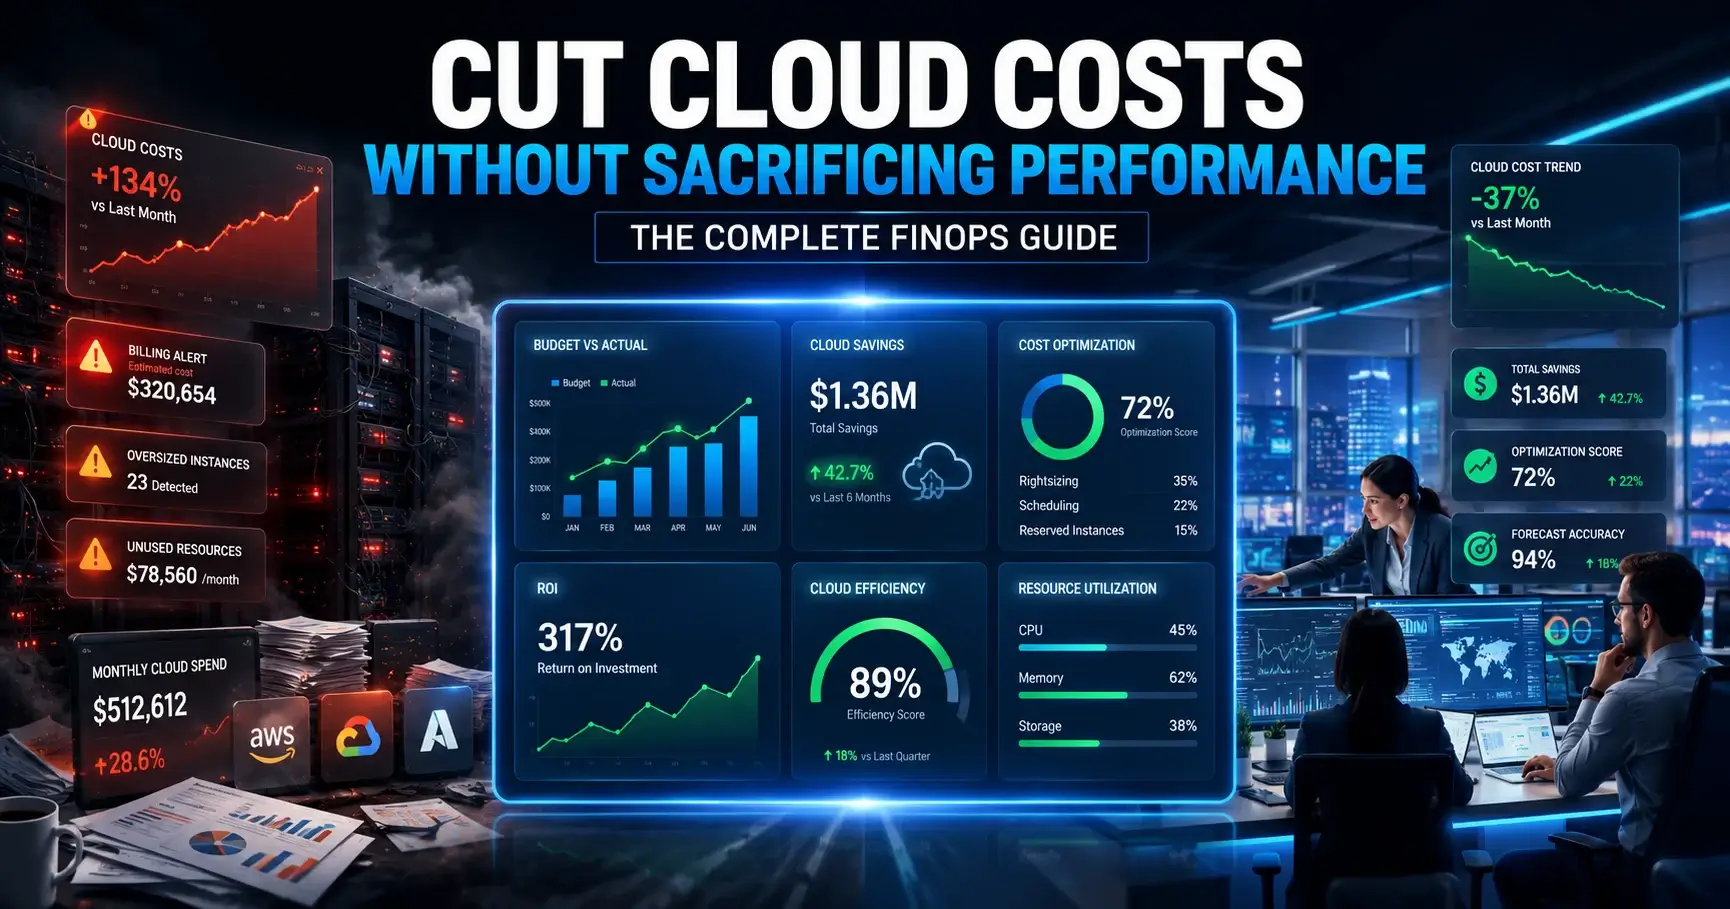
Cost optimization. Visibility into actual resource utilization — versus what's provisioned — routinely uncovers over-provisioned VMs, idle cloud instances, and oversized database tiers that can be right-sized without any performance impact.
IT infrastructure monitoring spans far more than "is the server on." A complete monitoring strategy covers every layer that a modern application depends on:
Treating each of these as an isolated silo is how blind spots form. A unified monitoring approach correlates data across all of them, so a network blip and a downstream API timeout are recognized as one incident, not two unrelated alerts.
For a deeper look at how these pieces fit into a broader managed strategy, see this overview of infrastructure management services.
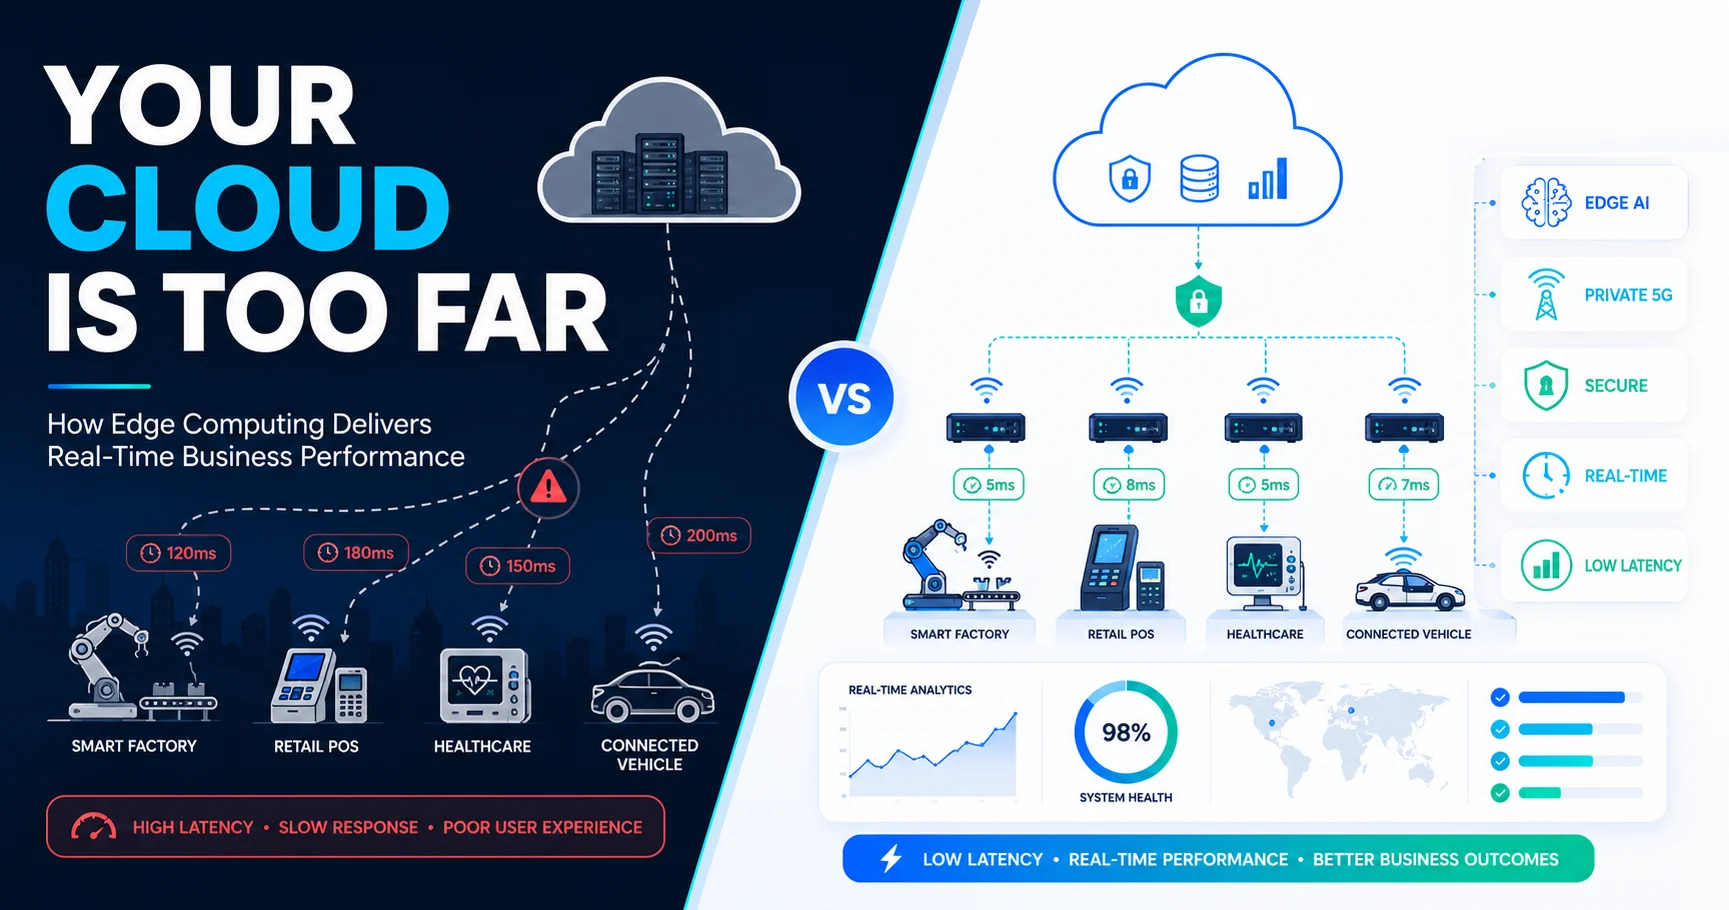
Cloud infrastructure monitoring brings its own rules. Unlike on-prem hardware, cloud resources are elastic, ephemeral, and billed by consumption — which means visibility gaps cost money as well as reliability.
AWS. Monitoring an AWS environment typically spans EC2 instance health, RDS database performance, Lambda function duration and error rates, and VPC-level network flow. Auto Scaling Groups make traditional host-based monitoring less useful on its own; monitoring needs to track fleets and services, not individual instances that may not exist an hour from now.
Azure. Azure environments add complexity around App Services, Azure Kubernetes Service (AKS), and hybrid Active Directory dependencies. Monitoring needs to account for resource groups and subscription-level boundaries, since a single application often spans several.
Google Cloud. GCP-based monitoring commonly centers on GKE clusters, Cloud Run services, and BigQuery workloads, with strong emphasis on label-based resource grouping for cost and performance correlation.
Hybrid cloud. Many enterprises run workloads across on-premises data centers and one or more public clouds simultaneously. Monitoring has to bridge both worlds with a consistent view — otherwise teams end up with two or three disconnected dashboards and no single source of truth during an incident.
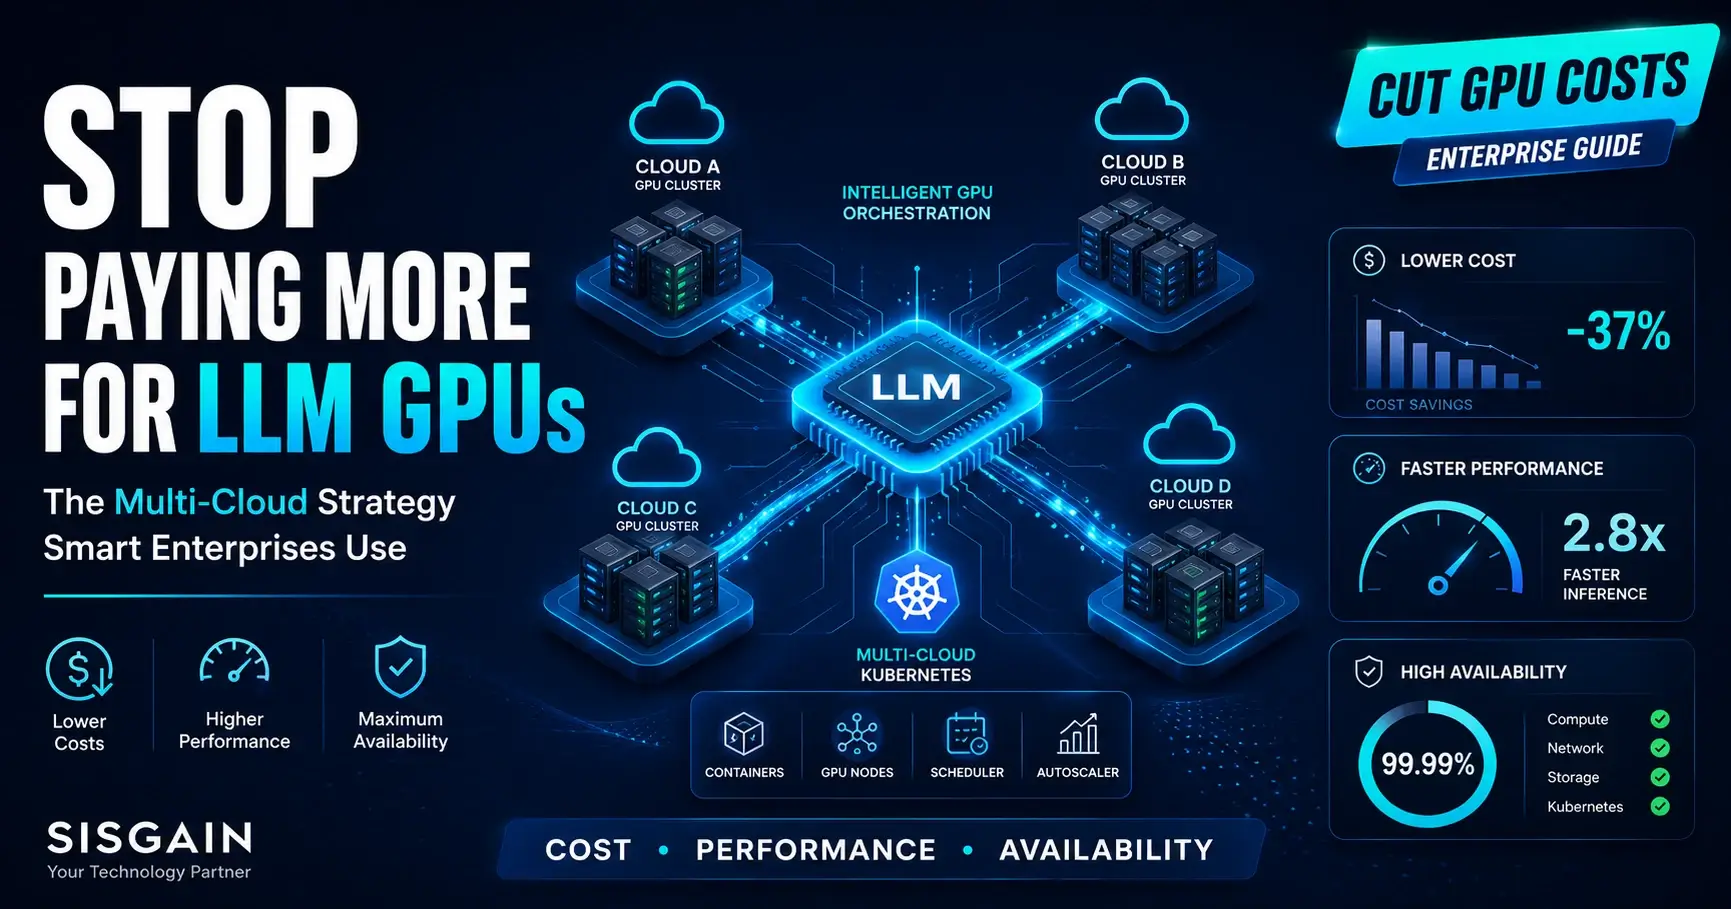
Multi-cloud. Organizations using AWS, Azure, and GCP together face the steepest visibility challenge: each provider has its own native monitoring tools (CloudWatch, Azure Monitor, Cloud Monitoring), and none of them sees across the others. A unified, cloud-agnostic monitoring layer is the only practical way to get one coherent picture.
Best practices for cloud infrastructure monitoring:
Organizations standardizing this kind of approach often pair it with a broader cloud managed services engagement, where monitoring, optimization, and operational ownership are handled together rather than bolted on separately.
Understanding the mechanics behind infrastructure monitoring makes it much easier to configure correctly and to trust the alerts it produces.
Metrics. Numeric, time-series data points — CPU percentage, memory usage, request count — collected at regular intervals. Metrics are the foundation of dashboards and trend analysis.
Logs. Detailed, timestamped records of events generated by systems and applications. Logs answer the "what exactly happened" question that a metric alone can't.
Events. Discrete occurrences — a deployment, a configuration change, an autoscaling action — that provide context for why a metric moved.
Alerts. Rules that compare live metrics against defined thresholds and notify the right people the moment a condition is breached.
Dashboards. Visual aggregations of metrics and events, built so a human can scan system health in seconds rather than querying raw data.
Thresholds. The lines that separate "normal" from "needs attention." Good thresholds are based on historical baselines, not arbitrary round numbers.
Automation. Triggered responses — restarting a service, scaling a cluster, rotating a credential — that resolve known issues without waiting for a human to act.
AI-assisted monitoring. Machine learning models that learn normal behavior patterns for a given system and flag deviations automatically, reducing reliance on manually tuned static thresholds.
Root cause analysis. The process — increasingly automated — of correlating metrics, logs, and events across components to identify why an issue occurred, not just that it occurred.
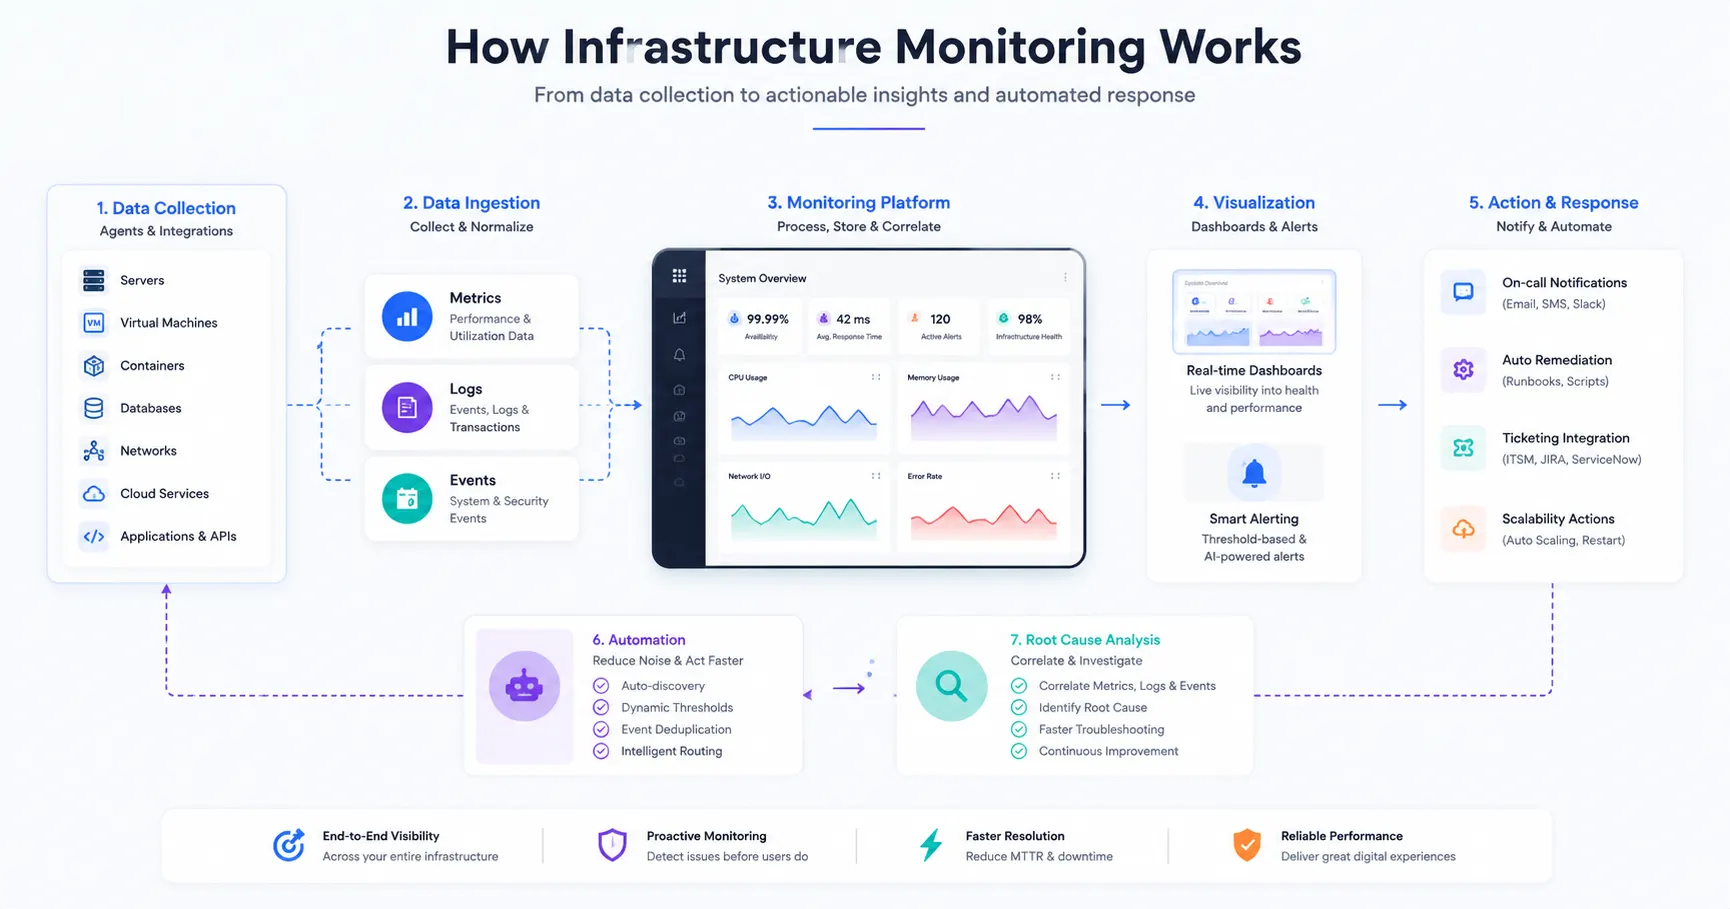
Put together, the flow looks like this: data is collected continuously → normalized and stored centrally → visualized on dashboards → compared against thresholds or learned baselines → alerts fire when something deviates → automation resolves what it can → humans investigate the rest using correlated logs and events for root cause analysis.
Not every metric deserves equal attention. These are the ones that consistently provide the earliest, clearest signal of trouble:
| Metric | What It Tells You |
|---|---|
| CPU Utilization | Whether compute capacity is being exhausted |
| Memory Usage | Risk of swapping, slowdowns, or out-of-memory failures |
| Disk Usage | Remaining storage headroom before failure |
| IOPS | Storage subsystem read/write performance under load |
| Network Latency | Delay in data transmission across the network |
| Packet Loss | Network reliability and connection quality |
| Availability | Whether a service is reachable and responding |
| Error Rate | Frequency of failed requests or transactions |
| Throughput | Volume of requests or data processed per unit time |
| Response Time | How long a system takes to respond to a request |
| Resource Utilization | How efficiently provisioned capacity is being used |
| Capacity | Headroom remaining before scaling is required |
| Service Health | Composite status combining the above into a single signal |
No single metric tells the whole story — response time without error rate context, or CPU without memory context, can mislead. Mature monitoring strategies look at metrics in combination, which is exactly why dashboards and correlated alerting matter more than any one number in isolation.
Different layers of the stack require different monitoring approaches:
| Monitoring Type | Primary Focus | Typical Owner |
|---|---|---|
| Server | OS-level resource health | Sysadmins / IT Ops |
| Network | Connectivity and bandwidth | Network Engineers |
| Cloud | Provider-managed resources | Cloud / Platform Teams |
| Storage | Capacity and I/O performance | Storage Admins |
| Container | Per-container health | DevOps / SRE |
| Kubernetes | Cluster orchestration health | Platform Engineering |
| Virtual Machine | Hypervisor and VM resources | Virtualization Admins |
| Database | Query and replication health | DBAs |
| Security | Anomaly and access detection | Security / SOC Teams |
Rather than chasing vendor names, it's more useful to evaluate infrastructure monitoring tools by category and fit. The right choice depends on environment complexity, team size, and existing toolchain — not which platform has the flashiest marketing.
| Tool Category | Ideal Use Case | Key Strengths | What to Evaluate |
|---|---|---|---|
| All-in-one infrastructure platforms | Mid-to-large enterprises wanting one pane of glass | Broad coverage, unified dashboards, strong integrations | Pricing model at scale, depth per component vs breadth |
| Open-source metrics & alerting stacks | Teams with strong engineering capacity wanting full control | Customizable, no licensing cost, large community | Operational overhead of self-hosting and maintaining |
| Cloud-native provider tools | Single-cloud environments | Deep native integration, no extra agents needed | Poor visibility across multi-cloud or hybrid setups |
| Network-focused monitoring tools | Network-heavy environments (telecom, large campuses) | Deep protocol-level visibility, topology mapping | Limited application/database depth |
| APM-centric platforms | Application performance is the primary concern | Code-level tracing, transaction visibility | May need pairing with separate infra-layer tooling |
| Log management platforms | Environments generating high log volume | Powerful search, correlation, forensic analysis | Cost scales fast with log volume; needs retention strategy |
Evaluation criteria worth prioritizing over feature checklists:
The strongest infrastructure monitoring software shares a common feature set, regardless of vendor:
When evaluating platforms against this list, weight auto discovery and AI-assisted alerting heavily — they're the two features most responsible for reducing the manual configuration burden as environments scale.
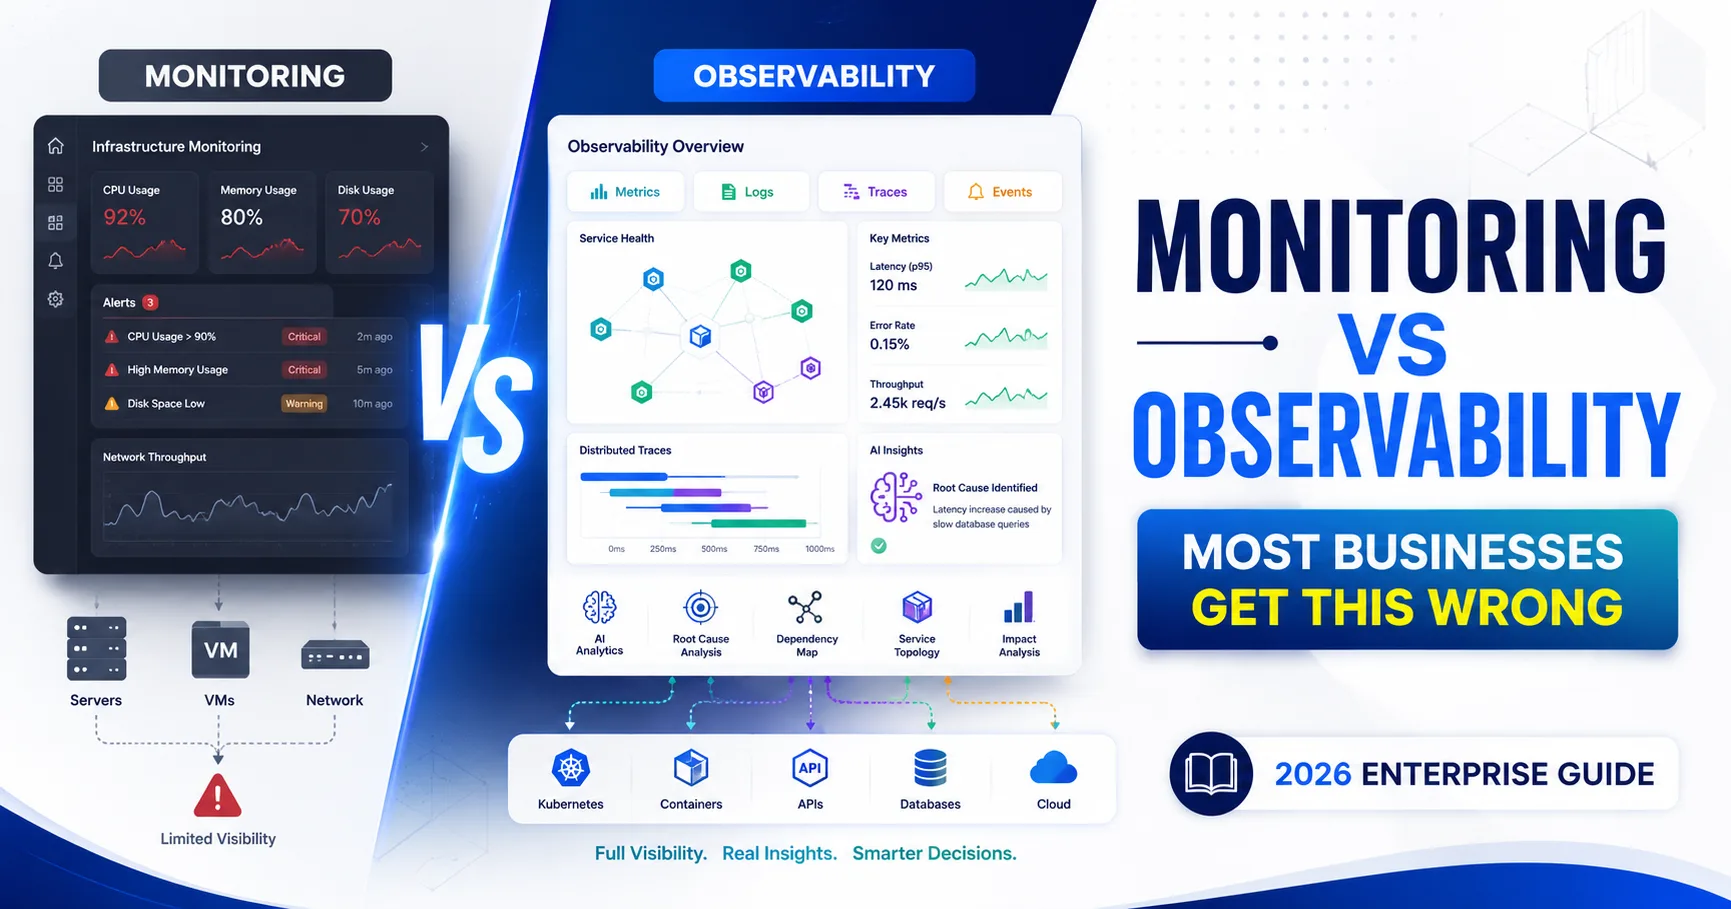
These terms get used interchangeably, but they're not the same thing.
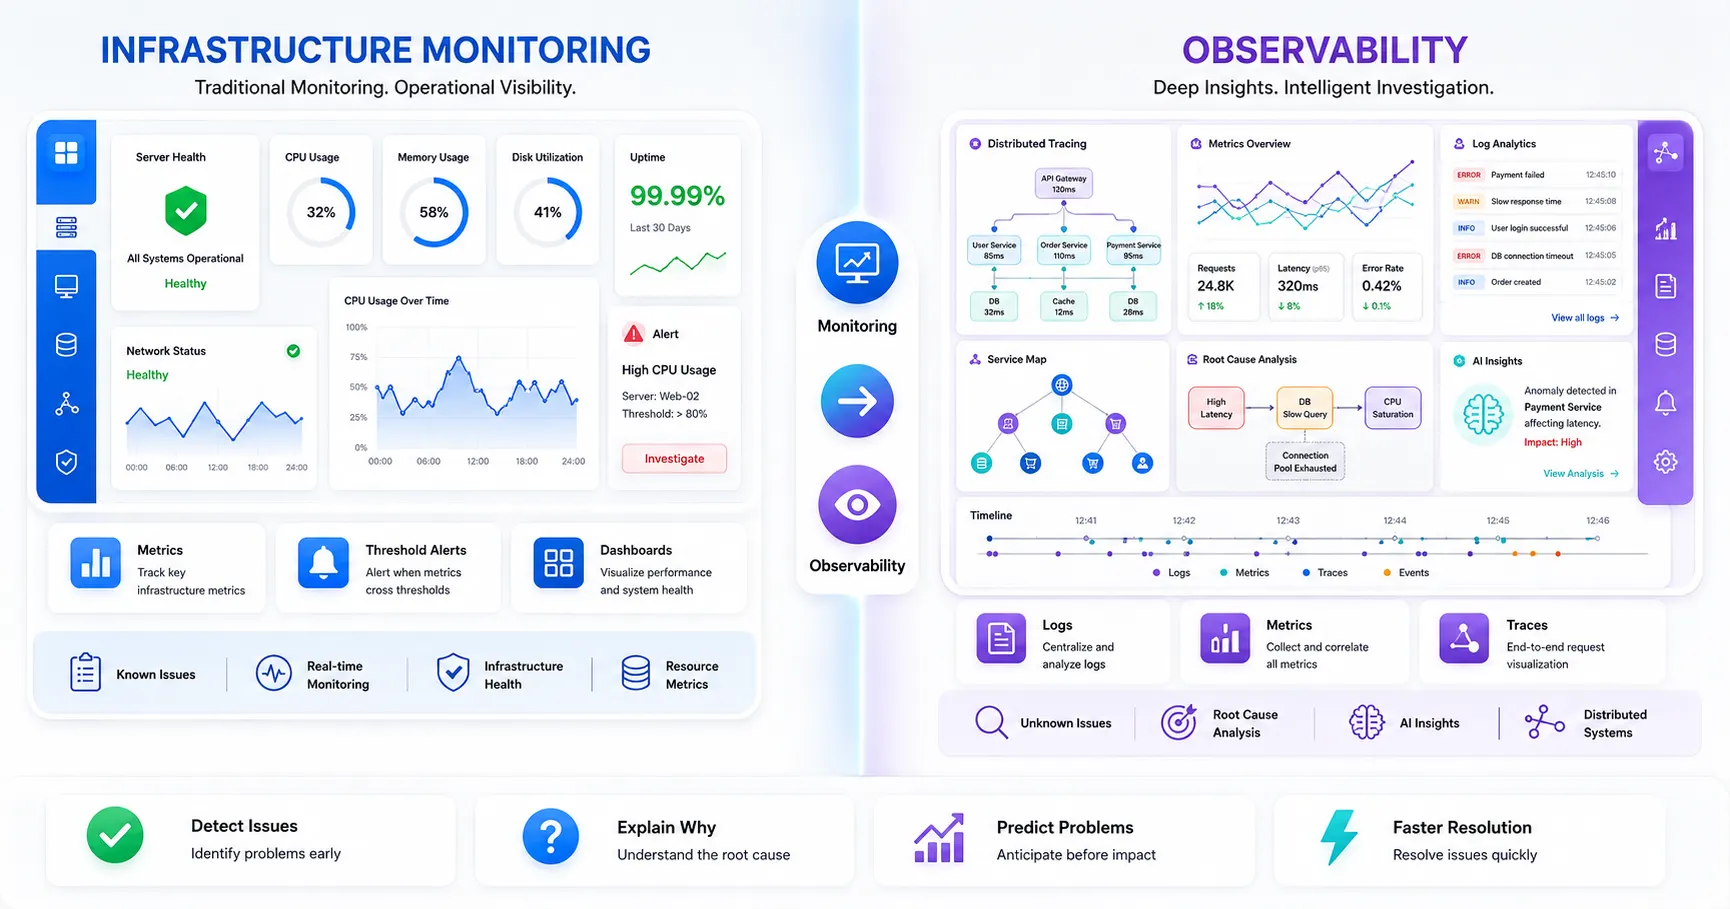
Infrastructure monitoring tells you that something is wrong — a server's CPU is at 98%, a service is down, a disk is nearly full. It's built on predefined metrics, thresholds, and dashboards designed to answer known questions.
Observability goes a step further, giving teams the ability to ask new questions about a system's internal state — using metrics, logs, and traces together — even for failure modes nobody anticipated in advance. It's especially valuable in complex, distributed, microservices-based architectures where the cause of an issue often isn't where the symptom shows up.
In short: monitoring tells you something is broken; observability helps you understand why, especially when the "why" wasn't something you thought to monitor for in the first place. Most mature organizations need both — monitoring for known, predictable failure modes, and observability for the unknown ones. We'll cover this distinction in much more depth in a dedicated article on infrastructure monitoring vs. observability.
| Aspect | Infrastructure Monitoring | Observability |
|---|---|---|
| Question Answered | Is something wrong? | Why is something wrong? |
| Data Used | Metrics, predefined thresholds | Metrics, logs, traces combined |
| Best For | Known failure modes | Unknown, novel failure modes |
| Setup Approach | Defined dashboards and alerts | Exploratory querying and correlation |
| Benefit | Business Impact |
|---|---|
| Reduced downtime | Protects revenue and SLA commitments |
| Faster troubleshooting | Shortens mean time to resolution (MTTR) |
| Cost optimization | Cuts wasted spend on over-provisioned resources |
| Compliance support | Reduces audit risk and reporting effort |
| Capacity foresight | Enables planned, not emergency, infrastructure investment |
Even well-resourced teams run into the same recurring obstacles:
| Challenge | Root Cause | Typical Fix |
|---|---|---|
| Alert fatigue | Overly sensitive or duplicate alerting rules | Alert correlation and severity tiering |
| Data overload | No prioritization strategy | Focus on business-impacting metrics first |
| Hybrid blind spots | Disconnected on-prem and cloud tooling | Unified, cloud-agnostic monitoring platform |
| Legacy system gaps | Missing modern monitoring agents | Custom exporters or proxy-based collection |
| False positives | Static, poorly tuned thresholds | Baseline-driven or AI-assisted thresholds |
Healthcare. Hospital systems monitor infrastructure supporting electronic health records (EHR) and connected medical devices, where downtime can directly affect patient care and HIPAA compliance depends on demonstrable system reliability.
Banking. Financial institutions monitor transaction processing infrastructure in real time, where milliseconds of latency or seconds of downtime carry direct regulatory and reputational consequences.
Retail. E-commerce platforms rely on monitoring to handle seasonal traffic spikes — flash sales, holiday shopping — where checkout and inventory systems must scale and stay responsive under sudden load.
Manufacturing. Industrial environments monitor infrastructure connected to production-line systems and IoT sensors, where downtime translates directly into halted physical output.
SaaS. Multi-tenant SaaS providers monitor infrastructure at both the platform and per-customer level, since a single noisy tenant or failing service can affect availability commitments across the customer base.
Logistics. Supply chain and logistics companies monitor infrastructure behind real-time tracking and routing systems, where outages cascade into delayed shipments and broken delivery promises.
Government. Public sector agencies monitor infrastructure supporting citizen-facing services, balancing strict compliance requirements with the reliability expectations of essential services.
Telecommunications. Telecom providers monitor network infrastructure at massive scale, where service degradation affects not just one application but the connectivity layer underneath many others.
AIOps. Machine learning increasingly handles correlation and anomaly detection at a scale manual rule-writing can't match, reducing the burden of maintaining thousands of static thresholds.
Predictive monitoring. Forecasting models flag likely future failures — disk exhaustion, performance degradation — days in advance, shifting teams from reactive fixes to scheduled maintenance.
OpenTelemetry. The push toward vendor-neutral instrumentation standards is reducing lock-in and making it easier to combine metrics, logs, and traces from different tools into one coherent view.
Automation. Self-healing infrastructure — automatic scaling, restarts, and remediation triggered directly by monitoring signals — continues to expand beyond simple, well-understood failure patterns.
Intelligent alerting. Alert correlation engines are getting better at grouping related symptoms into a single incident notification instead of flooding on-call staff with a dozen separate pages for one root cause.
Cloud-native monitoring. As more workloads move to Kubernetes and serverless architectures, monitoring tooling continues to evolve away from host-centric models toward service- and workload-centric visibility.
These trends point toward a broader shift: monitoring is moving from a passive, dashboard-watching discipline toward an active, automated layer of the platform itself — which is increasingly the territory covered by platform engineering services.
Infrastructure complexity isn't going to simplify itself — if anything, multi-cloud adoption, container orchestration, and distributed architectures are making environments harder to see into, not easier. Infrastructure monitoring is the discipline that keeps that complexity from turning into downtime, lost revenue, and damaged trust.
The organizations that get the most value from it share a common pattern: they monitor at the service level, not just the resource level; they tune alerts deliberately instead of letting noise accumulate; and they treat monitoring as a living, evolving part of their architecture rather than a one-time setup task.
If your current monitoring strategy still relies on reactive firefighting, fragmented dashboards across cloud providers, or alert fatigue that's trained your team to tune out notifications, now is the right time to reassess. Start by mapping where your blind spots actually are — across cloud, hybrid, containers, and on-prem — and build outward from there.
For a broader view of how monitoring fits into a complete operational strategy, explore this guide on cloud infrastructure management, or connect with a team that can help design and implement infrastructure management services tailored to your environment.

Start Build Your
Next Digital Solution?
Let’s build scalable, future-ready digital solutions tailored to your business goals. Connect with our experienced technology consultants to discuss your vision, strategy, and growth opportunities — with zero obligation and complete transparency.
Get a free consultation and cost estimate for your digital solution
Our expert will contact you within 24 hours. Check your email for confirmation.
Partner with SISGAIN experts to build secure, scalable AI-powered IT Solutions that transform your business operations.


DUQE FREEZONE Quarter Deck, Queen Elizabeth 2, Mina Rashid, Dubai, UAE

100 Consilium Pl Suite 200, Scarborough, ON M1H 3E3, Canada

C-109, Sector 2, Noida, Uttar Pradesh 201301 India
Project quotes, partnerships, implementation
Open roles, referrals, campus hiring